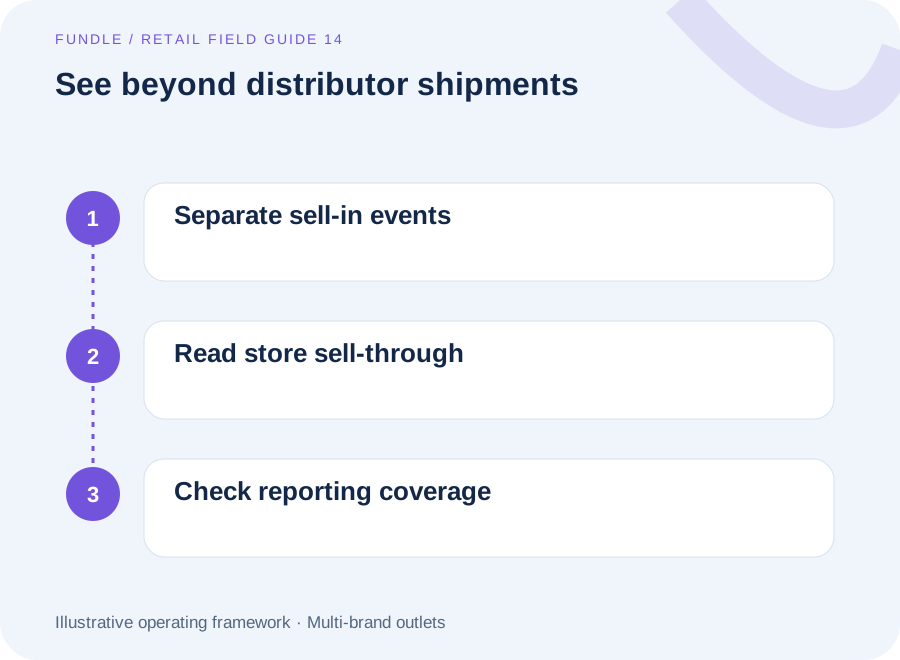
MBO intelligence: distinguish sell-in growth from real consumer sell-through
How should brands distinguish MBO sell-in from sell-through?
Measure sell-in as the defined movement from the brand or distributor into the multi-brand outlet, and sell-through as verified sales from that outlet to consumers. Connect both to receipts, returns, transfers and stock balances at variant and location level. Evaluate replenishment using consumer demand and available stock, while showing outlet reporting coverage and timing gaps.
Start by naming the event behind the number
A brand can ship more goods into its multi-brand outlet network while consumers buy fewer. Sell-in growth can reflect opening orders, a promotion, an earlier dispatch or channel inventory accumulation. Sell-through describes a different event: the outlet's sale to the consumer. Both matter, but they should appear as separate measures.
Agree whether sell-in means invoiced, dispatched or received units. Those events can occur on different dates and may have different reversal processes. Use the term consistently and retain the other event timestamps so a late receipt does not look like missing stock or weak consumer demand.
Establish the outlet and variant foundation
Create a stable outlet master including partner, physical location, channel classification and reporting status. Distinguish an outlet from the legal customer account that may cover several locations. Connect each outlet's product code to the brand's approved variant, preserving size, colour, unit quantity and effective dates.
GS1's product-variation guidance supports keeping distinct variants identifiable. In practice, a style-level total can conceal the fact that popular sizes are unavailable while slow sizes remain in stock. MBO planning needs both the family view and the operational variant detail.
Reconcile movement before interpreting demand
For a defined period, build a stock bridge: opening stock plus receipts and inbound transfers, minus consumer sales and outbound transfers, adjusted for documented returns and other movements, equals expected closing stock. Show the sign and treatment of each movement explicitly.
| Event | What it establishes | What it does not establish |
|---|---|---|
| Brand dispatch | Goods left the sending location | Outlet received them |
| Outlet receipt | Goods entered outlet custody | Consumer bought them |
| Consumer sale | Reported purchase at the outlet | Cash reached the brand |
| Stock adjustment | Recorded balance changed | A verified sale occurred |
| Customer return | Consumer sale was reversed | Stock is immediately saleable |
Compare expected closing stock with the reported or counted balance. Investigate gaps before using the balance for replenishment. A stock adjustment should carry evidence and an approver rather than act as an automatic balancing plug.
Worked hypothetical example: strong shipments, weak replenishment logic
An outlet begins a month with 100 units, receives 80 and sells 60 to consumers. With no returns or transfers, expected closing stock is 100 + 80 − 60 = 120 units. Sell-in is 80 units on a received basis, while sell-through volume is 60.
For this example, define period sell-through rate as net consumer units sold divided by opening units plus receipts: 60 / 180 = 33.33%. This is an explicitly chosen management definition. At a recent sales pace of 15 units per week, 120 available units represent eight weeks of cover, assuming demand stays stable.
Dispatching another 80 units because last month's sell-in was 80 would lift stock to 200 units before further sales. The better decision requires size-level availability, lead time, expected demand and transfer options. The example is hypothetical and does not establish a universal target rate or stock-cover threshold.
Keep formulas visible across partner systems
Different systems can calculate sell-through differently. Shopify's product analytics documentation, for example, states its own sold-versus-sold-plus-inventory denominator and reporting window. Do not combine partner percentages without checking whether their periods, populations and stock definitions agree.
Prefer recalculating a common measure from agreed underlying quantities. Where that is impossible, label partner-reported measures clearly and compare them only within a consistent scope. Keep gross sales, net sales and units returned visible so a returns-heavy outlet does not appear strong solely on transaction volume.
Treat missing data as a separate operating issue
Record expected reporting days, received files and the last complete outlet day. Missing sales are not zero sales. A zero should be an explicit observation from a reporting outlet or a verified closed day, with the relevant context retained.
Publish network metrics alongside coverage by outlet count and, where a reliable baseline exists, business weight. Compare like-for-like reporting outlets over time. A network total can rise simply because more outlets submitted data, while the comparable outlet set is declining.
Give missing-data follow-up a named owner. Store a correction history when partners send revised files, and prevent repeated imports from duplicating sales. Useful intelligence begins with knowing which part of the channel you can actually see.
Turn the view into outlet-specific action
Combine consumer demand, available size curve, stock age and lead time. A fast-selling style with a broken size curve may need redistribution. A slow style with complete availability may need merchandising review. An outlet with stale data needs reporting repair before an aggressive replenishment decision.
Commercial terms also matter. Credit limits, minimum shipment quantities and partner commitments can constrain the preferred stock move. Make the constraint visible and record the agreed alternative rather than presenting an impossible recommendation as an actionable plan.
Practical weekly review checklist
Confirm outlet identity, variant mapping, receipts, consumer-sale coverage and stock reconciliation. Review stale feeds, negative balances, unusual adjustments and unexplained stock age. Agree actions for specific variants and outlets, then check whether the next receipt, transfer or consumer sale supports closure.
For a MBO workflow walkthrough, bring one replenishment case and one apparent overstock case. Evaluate how Fundle Brain could make the distinction between shipment growth and consumer demand explicit. The discussion should establish data access, definitions and responsibility before assuming any partner integration or automated replenishment capability.
Questions from retail teams
Can a dispatch file be used as secondary sales data?
A dispatch file establishes movement from the sender, not a consumer sale. It can support sell-in and stock-in-transit analysis when its definitions are clear. Secondary or outlet consumer-sales analysis needs the corresponding outlet evidence. If that evidence is unavailable, label the limitation rather than presenting dispatch growth as consumer demand.
Why can a growing outlet still need less replenishment?
Growth can coincide with excess receipts, a slowing recent sales pace or an imbalanced size curve. Review available stock, incoming commitments, lead time and demand at variant level. More total sales do not automatically justify more of every item, particularly when slow variants already occupy working capital and selling space.
Which sell-through formula should an MBO network use?
Choose a documented formula that fits the planning decision and can be calculated consistently from partner data. State the period, treatment of returns, transfers and opening stock. Different software reports use different denominators, so never average their percentages blindly. Recalculate from comparable quantities where possible and disclose exceptions.
How should we handle an outlet that reports weekly instead of daily?
Keep its reporting cadence explicit and mark the latest complete period. Do not distribute weekly sales evenly across days unless the result is clearly labelled an estimate for a specific purpose. For daily decisions, combine that limitation with current stock or partner confirmation and avoid implying visibility that the data cannot support.
What makes a zero-sales alert credible?
The outlet must have submitted a complete record for the relevant trading period, with functioning product mapping and no known reporting failure. Check whether the store traded and whether stock was available. A missing file or unmapped product should create a data exception, while a verified zero can trigger an operational investigation.
Sources and further reading
- GS1: GTINs for sizes and colours — GS1 guidance on unique identification of product variants.
- Shopify: Product analytics overview — An example of an explicit sell-through denominator and reporting period, not a universal formula.