An EBO daily performance dashboard that changes the store conversation
What should an EBO daily performance dashboard show?
An exclusive brand outlet dashboard should show comparable sales, completed bills, units, returns, traffic coverage and customer identification alongside operational exceptions. Every number needs a stated period, store set and denominator. Use the dashboard to assign a next action, such as investigating a size gap or fixing a missing feed, rather than to rank stores using incompatible totals.
Start with the morning decision
An EBO manager needs to know what deserves attention before the next trading shift. A dashboard that mixes yesterday’s bills with late returns, today’s stock and last week’s traffic cannot answer that reliably. Begin with the decision: adjust staffing, investigate conversion, contact an eligible cohort, replenish an article or resolve a reporting exception. Each decision needs a different slice of evidence.
Choose a trading-day cut-off in the store’s timezone and display the extraction time. For an Indian store network, document how late-night trading is assigned to a business date. Keep provisional and closed days visibly different. A late file should update the reporting status before it changes a performance conclusion.
Separate the grains before choosing the charts
Maintain order, order-line, payment, return, traffic and stock records separately. An order with three products remains one bill. Two payment methods do not create two purchases. A return recorded today can relate to a sale from an earlier period. Joining every table without controlling these relationships can multiply revenue.
The Shopify retail reports documentation illustrates why scope matters: those reports cover POS-location sales, and staff-credit reports differ from reports organised by the register operator. Use the same discipline in any EBO stack; do not assume every vendor uses identical definitions.
For each metric, store the source, grain, filter and refresh rule in a short metric dictionary. Give the store manager a plain-language definition and the analyst enough detail to reproduce it. Keep cancelled orders, test bills and transfers distinguishable from customer purchases.
Build a compact decision table
| Review question | Metric and denominator | Required context | First operating action |
|---|---|---|---|
| Did trading weaken? | Merchandise net sales for the chosen day | Discounts, sales reversals, comparable stores | Identify category and bill-count drivers |
| Did baskets change? | Sales-cohort value divided by completed purchase bills | Treatment of later returns | Review article mix and basket composition |
| Did conversion change? | Purchase bills divided by measured shopper entries | Counter coverage, exclusions and downtime | Inspect affected hours before changing staffing |
| Did unit selling change? | Sold units divided by completed purchase bills | Units and bills from the same cohort | Check size availability and selling context |
| Can we recognise customers? | Identified purchase bills divided by eligible purchase bills | Matching rules and optional collection process | Fix capture friction without inventing identities |
| Can we trust the picture? | Received valid feeds divided by expected feeds | Active store list and cut-off | Assign the missing-source exception |
These are recommended definitions, not universal accounting formulas. Keep finance-approved sales measures intact and label alternative operating measures clearly.
A worked hypothetical example
Assume a store records 80 completed purchase bills and 120 sold units yesterday. Merchandise value before discounts is ₹2,00,000, discounts are ₹20,000, and the day also contains ₹10,000 of sales reversals from older purchases. Taxes and delivery charges are excluded throughout this illustration.
Purchase-bill value after discounts is ₹1,80,000. Dividing by 80 bills gives a purchase-cohort average of ₹2,250. Units per transaction are 120 ÷ 80 = 1.5. The period’s net merchandise sales are ₹1,70,000 after the older reversals. Dividing that period amount by yesterday’s 80 bills would produce ₹2,125, but it mixes an older return cohort with new purchases. Show both measures with their definitions instead of silently treating them as interchangeable.
If the counter records 400 eligible entries with full coverage, bill-to-entry conversion is 80 ÷ 400 = 20%. If 48 purchase bills have a reliable customer identifier, identification coverage is 48 ÷ 80 = 60%. Neither number identifies the cause of a sales change. The manager still needs comparable hours, category availability and customer context.
Read movement in an ordered sequence
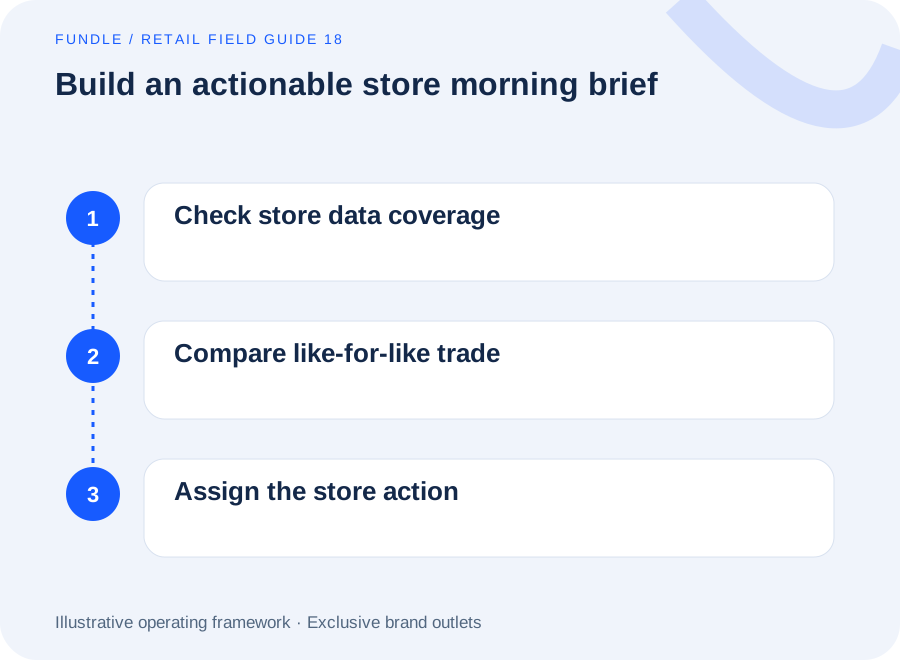
First establish coverage. Then compare the same stores and equivalent trading periods. Next separate bill count, basket value and returns. Finally investigate product, hour and staff context. This order prevents the team from explaining missing data as weak selling.
If bills fall while entry coverage is stable, investigate conversion and service conditions. If bills hold but basket value declines, review product mix, discounts and missing sizes. If net sales fall because old returns rose, involve the category or service owner. A generic instruction to sell harder is not a diagnosis.
Use Shopify’s sales-discrepancy guidance as a documented example of how timing, grouping and the separation of returns from refunds create apparently conflicting reports. The general operating recommendation is to reconcile definitions before escalating a system defect.
Keep comparison fair
Do not rank a recently opened outlet against a mature store without context. Identify relocation, temporary closure, changed trading hours and incomplete traffic feeds. For same-store analysis, freeze the eligible comparison set and explain exclusions. Maintain a separate network total so excluded locations remain commercially visible.
Staff sales need particular care. Selling assistance, checkout processing and team coverage are different contributions. A cashier may process another associate’s assisted sale. Use staff data to investigate an operating question and improve coaching; a report’s attribution field does not by itself establish an individual’s causal contribution.
The practical daily review checklist
- Confirm which stores and feeds are complete, provisional or missing.
- Reconcile purchase, reversal and payment definitions with the source reports.
- Check traffic coverage before presenting a conversion percentage.
- Select comparable days, hours and outlet sets.
- Identify one material movement and drill to supporting source rows.
- Assign an owner, a next step and a time for follow-up.
- Revisit yesterday’s action and record whether the evidence changed.
A useful dashboard ends with fewer unresolved questions, not more coloured tiles. Keep the first version small enough that the daily meeting can actually use it.
Evaluate the decision interface
Explore the questions on the retail intelligence page and connect retention questions to loyalty and customer lifecycle management. Request a Fundle workflow walkthrough using a representative day, a late return and an incomplete store feed. Ask how the proposed interface preserves definitions, shows source coverage and prepares an accountable next action. Confirm the available connections and permissions for the deployment.
Questions from retail teams
Should an EBO dashboard use gross sales or net sales?
Use both only when they answer different questions and their definitions are visible. Gross merchandise activity helps explain demand and discounting; a net measure includes the agreed reversals and adjustments. Finance should approve the definitions. Avoid replacing a recognised finance measure with a convenient dashboard total that uses different dates or exclusions.
How should yesterday’s dashboard handle a return from last month?
Show the reversal in the operating period where the source records it, while preserving the original sale link. For purchase-cohort analysis, allocate it back to the relevant cohort under an explicit rule. Label these views separately so the manager can distinguish today’s selling performance from the period’s return burden.
Can bill count divided by footfall be called conversion?
It can be a defined bill-to-entry conversion measure if both datasets cover the same store, hours and population. Explain repeat entries, staff exclusions, counter outages and multiple bills per shopper. Without stable counting rules, the percentage is an operating proxy rather than a reliable estimate of unique shoppers buying.
Which dashboard issue should the regional manager fix first?
Prioritise an issue that changes the business decision: a missing store feed, duplicated bills, an incorrect return join or broken traffic coverage. Cosmetic chart improvements can wait. Once the evidence is dependable, investigate the largest comparable commercial movement and assign an owner with a clear follow-up question.
Does an AI summary remove the need for a metric dictionary?
No. A fluent summary can still mix incompatible sales periods, stock snapshots or customer denominators. Require the proposed interface to state the selected scope, definitions and evidence limitations. Keep the metric dictionary available to the analyst and request a walkthrough of corrections before using generated explanations in operating reviews.
Sources and further reading
- Shopify retail sales reports — Documented example of POS-only scope and distinctions between staff credit and register processing; metric design is editorial guidance.
- Shopify sales discrepancies — Timing, grouping and return/refund differences can explain report discrepancies; not a claim about Fundle integration.