
Set the comparison
Choose the question, dates and business scope. Agree whether the comparison is calendar-based, like-for-like or cohort-based.
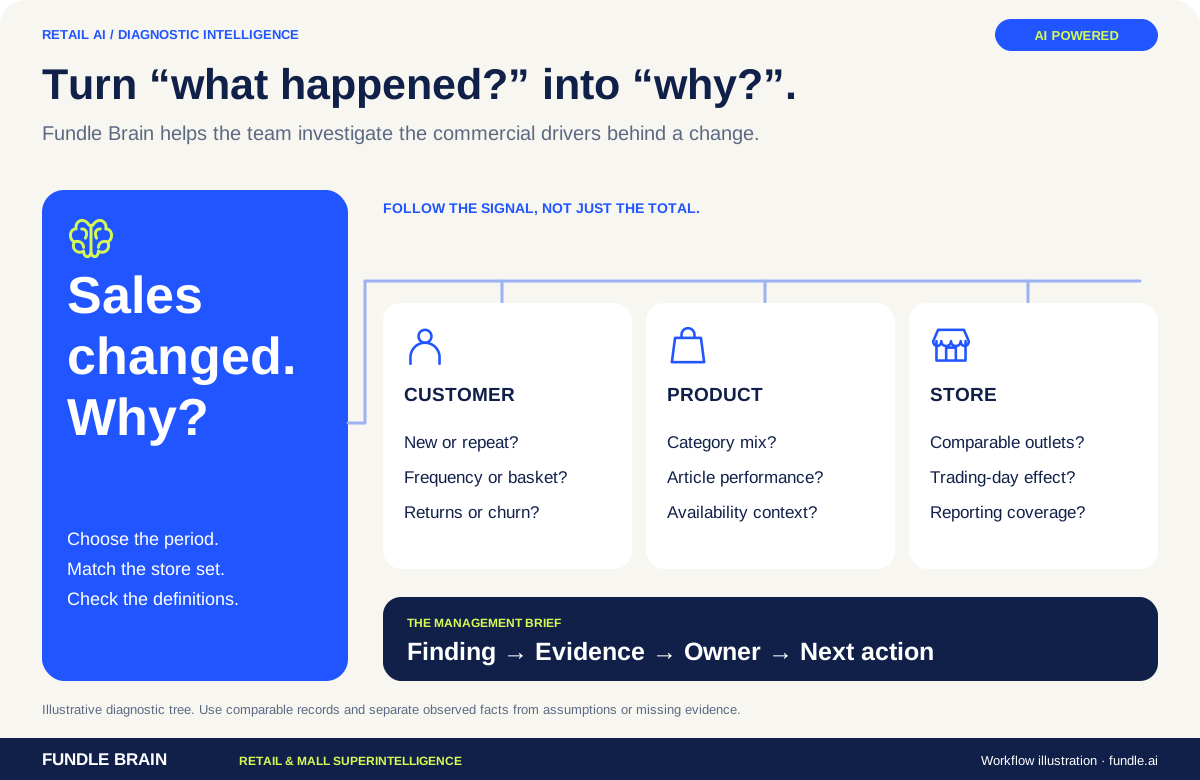
Explore sales, customer behaviour and store performance in business language, with the data context behind each answer.
Why did repeat sales fall in our North region?
24 seconds · Silent film with on-screen captions · Workflow illustration.
Why did repeat sales fall in our North region?
Scope → Compare → Explain → Act. Sales + customers + store hierarchy + time
Ask why. Follow the signal. Find the next move. Explore the infographic below the film for the full workflow.
Prepare a concise diagnosis and follow-up questions. Repeat rate · like-for-like sales · basket value
Fundle’s retail command centre brings city, store and date filters together with sales, basket, repeat behaviour and loyalty measures. Fundle Brain adds a business-question interface so the analysis can begin with what the team needs to understand.
Read sales, customers, transactions, average order value and units per transaction within the selected city, store and period.
Review repeat behaviour, signup cohorts and points liability together. A sales increase driven by new acquisition tells a different story from stronger existing-customer demand.
The command centre includes sales trends and API-health visibility. Check coverage and freshness before interpreting a sudden change.
Use the diagnosis to frame a campaign, store investigation or merchandising discussion. Carry the period, filters and metric definition into the resulting brief.
Start with the question. Define the data and workflow needed to answer it.
Reliable retail analysis starts with the decision and a consistent dataset, not with the AI model. For sales and store comparisons, use transaction dates, amounts, returns, product definitions and a stable store hierarchy. For repeat-customer analysis, add a consistent customer or member key where appropriate.
Before comparing results, check which stores and periods are covered, how late records and refunds are handled, and when each source was last updated. Agree the metric, denominator and comparison window. A missing store feed or a changed customer definition can look like a trading change. Use only the data needed for the question, and check material findings against the source records.
Conversational analysis, supporting comparisons and prioritised action briefs.
Use stable metric definitions and comparable periods. A useful answer exposes the scope and supporting comparison; faster reporting is valuable only when the answer remains reproducible.
Use the underlying period, filters and metric definitions to assess the answer. Material decisions should be checked against source data and the agreed business rules.
Use city, store and date filters to explore sales, average order value, repeat behaviour, customers, transactions, units per transaction and points liability. Sales trends, signup cohorts and API health provide additional operating context.
It provides a business-language starting point for investigation. The interface supports questions across loyalty, sales, customers and campaigns; the underlying records and definitions still determine the quality of the answer.
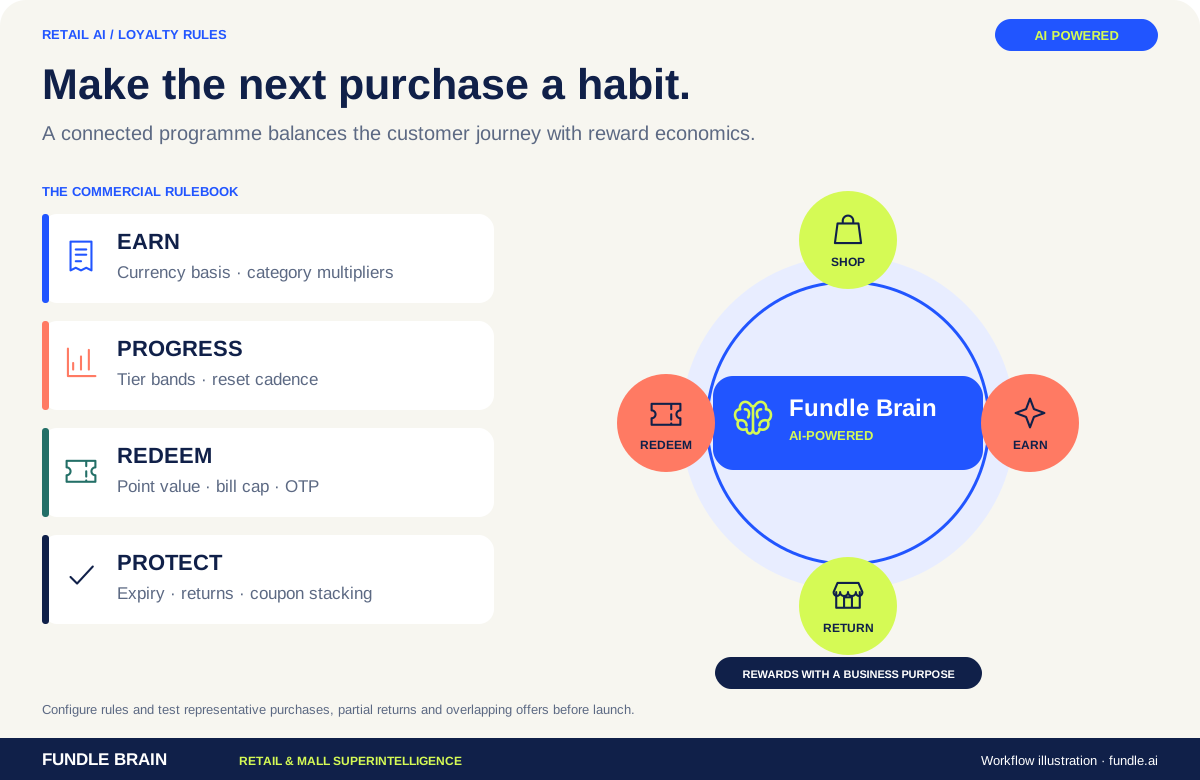
Connect points, tiers, customer behaviour and campaign decisions around one goal: a stronger relationship after every sale.
Explore the platform ↗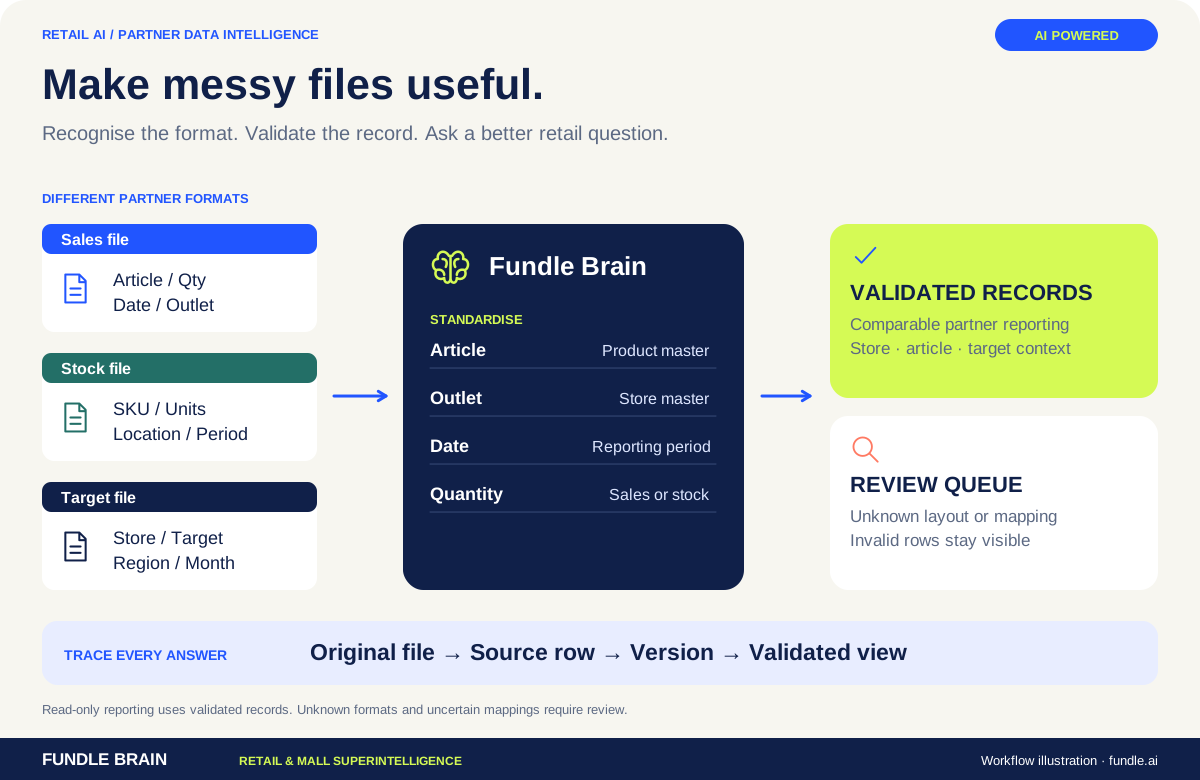
Turn inconsistent partner sales files into traceable secondary-sales intelligence for your multi-brand outlet and shop-in-shop business.
Explore the platform ↗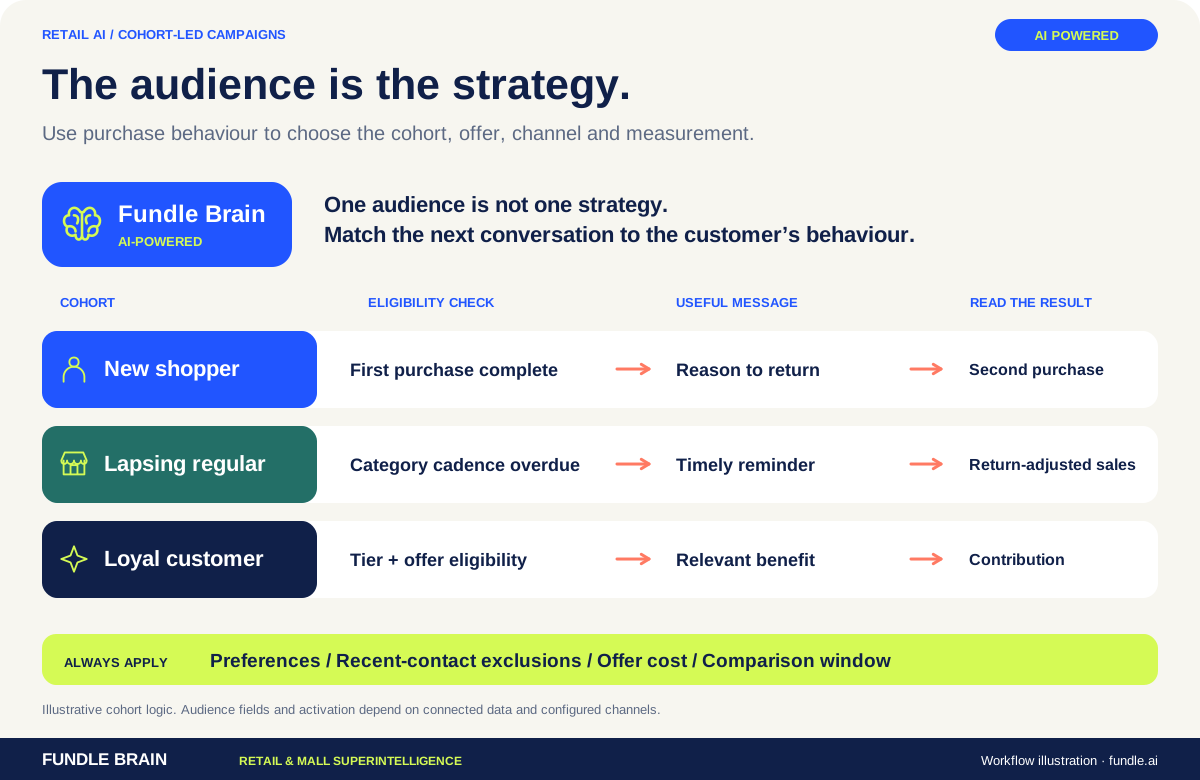
Move from a broad discount blast to a precise audience, a relevant offer and a clear way to measure the result.
Explore the platform ↗Bring us one business problem. We’ll map the data, the workflow and the next useful action.
Abhinav · Fundle.ai
Loyalty & ADSR Expert · Online