
Frame the management question
Choose the period, property scope and decision. Specify whether the focus is trading, tenant performance, visitor engagement or media.
Bring tenant performance, reporting gaps, campaigns and operating priorities into a practical management conversation.
Give me today’s mall management brief.
24 seconds · Silent film with on-screen captions · Workflow illustration.
Give me today’s mall management brief.
Report → Explain → Coordinate → Review. Tenant sales + reporting + campaigns + operations
Turn the trading day into a better decision. Explore the infographic below the film for the full workflow.
Prepare a prioritised brief with next steps. Decision speed · issue closure · commercial performance
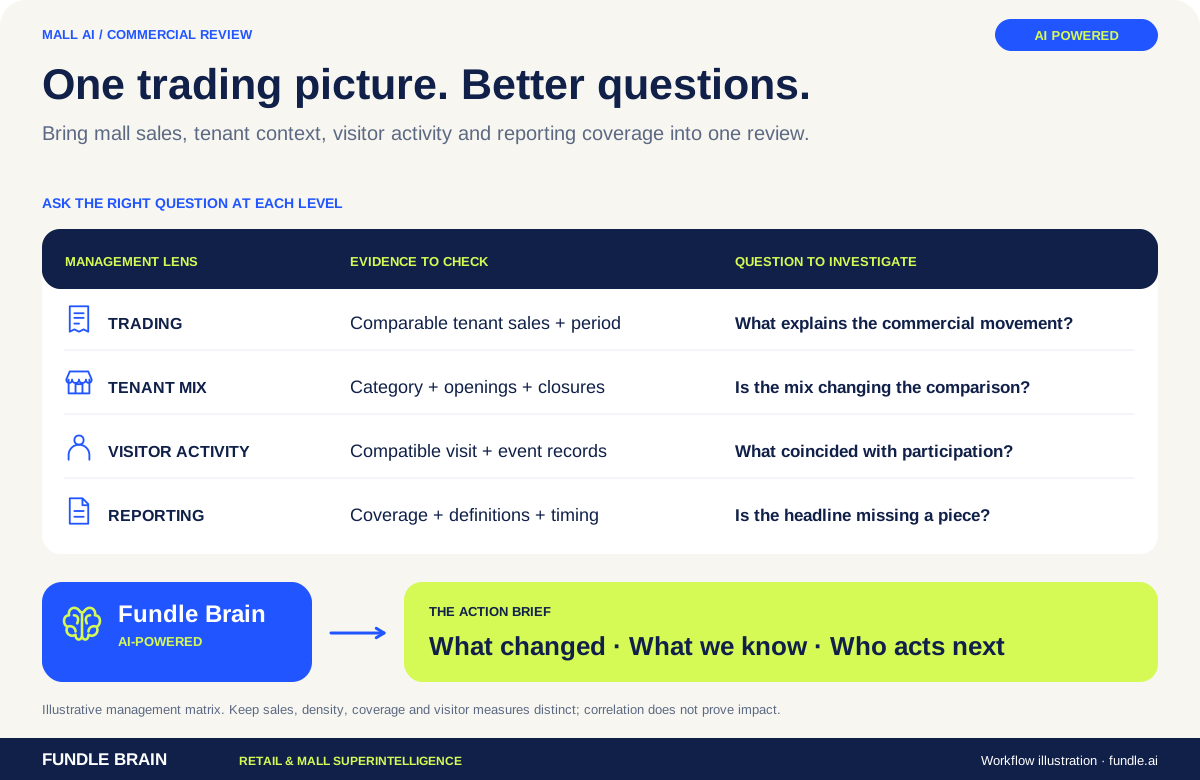
Sales, reporting coverage, tenant mix, visitor activity and campaigns each describe a different part of the mall. The intelligence workflow connects the available evidence around a management question and makes the boundaries of the comparison clear.
Begin with validated tenant sales and reporting completeness. Keep late or missing submissions visible in the same review as headline performance.
Compare the relevant categories and tenant sets. Explain the effects of openings, closures, area changes and different trading calendars.
Bring footfall, event participation or campaign response into the analysis where the data exists. Align time windows and avoid implying that correlation establishes campaign impact.
Translate the analysis into a short list of investigations or operating actions. Identify the responsible team and the evidence needed to resolve each question.
Start with the question. Define the data and workflow needed to answer it.
Validated tenant sales, reporting status, campaign records and agreed operating data.
Management brief, tenant or category questions and prioritised action list.
Keep sales growth, trading density, reporting completeness and visitor measures distinct. Use consistent definitions and periods; explain when a source does not support a causal conclusion.
Yes, where the data scope supports it. Align category, period, area and reporting definitions before using cross-property benchmarks.
Yes, where both datasets are available with compatible periods and property coverage. Confirm the counting method and avoid treating every counted visit as a unique shopper.
A portfolio view requires aligned property, tenant, area and reporting definitions. Preserve local context while using common measures for comparisons.
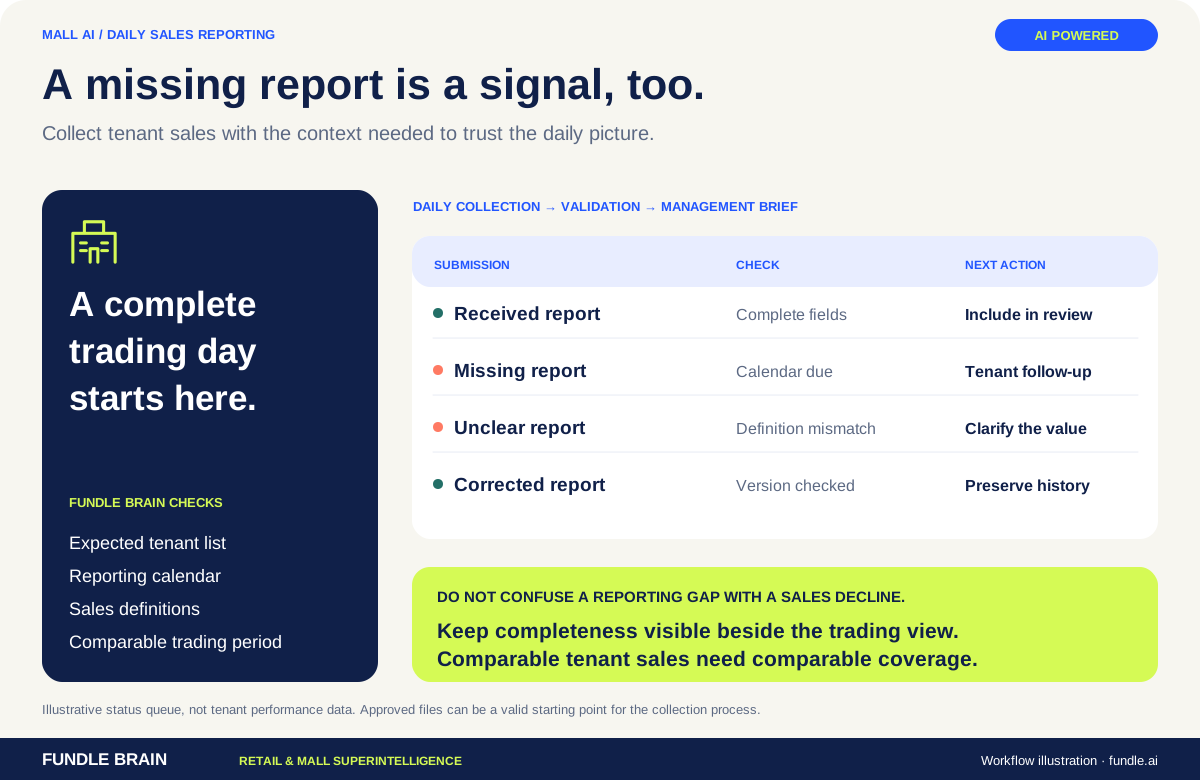
Automated Daily Sales Reporting connects tenant submissions and sales intelligence so mall teams know what is complete, what changed and what needs attention.
Explore the platform ↗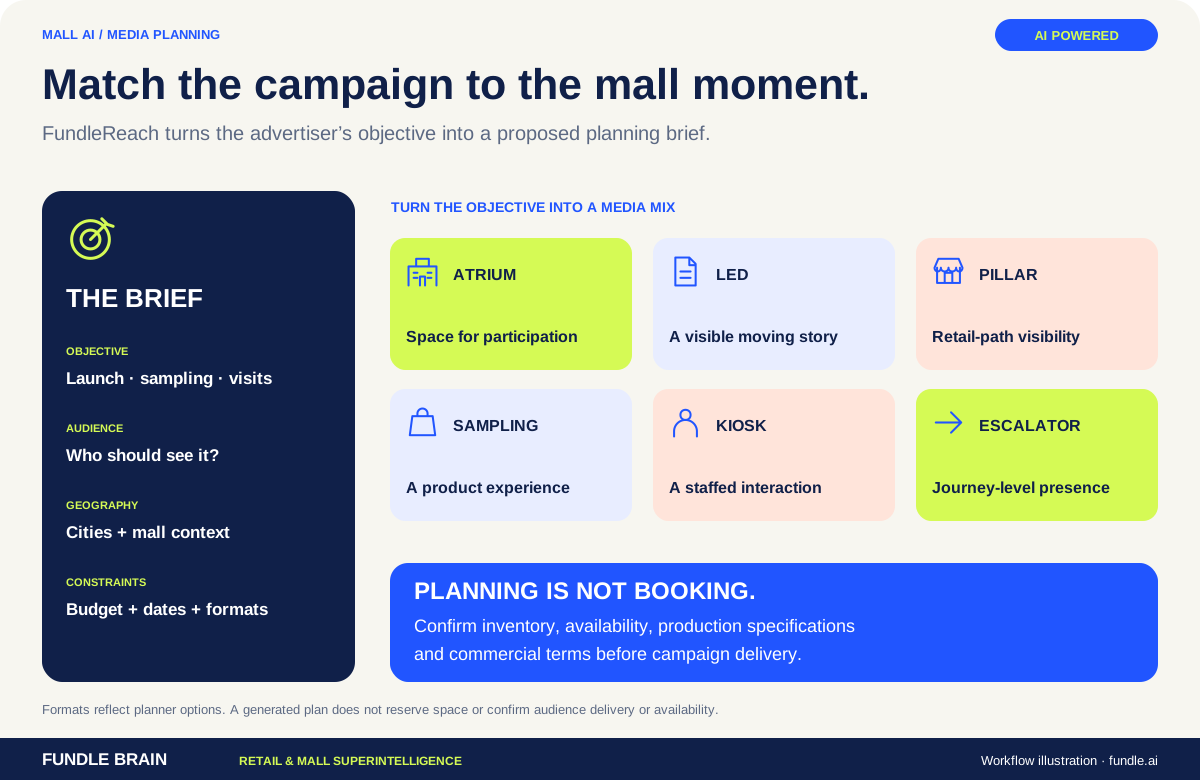
Connect mall media inventory, advertiser briefs and campaign delivery into a clearer commercial workflow.
Explore the platform ↗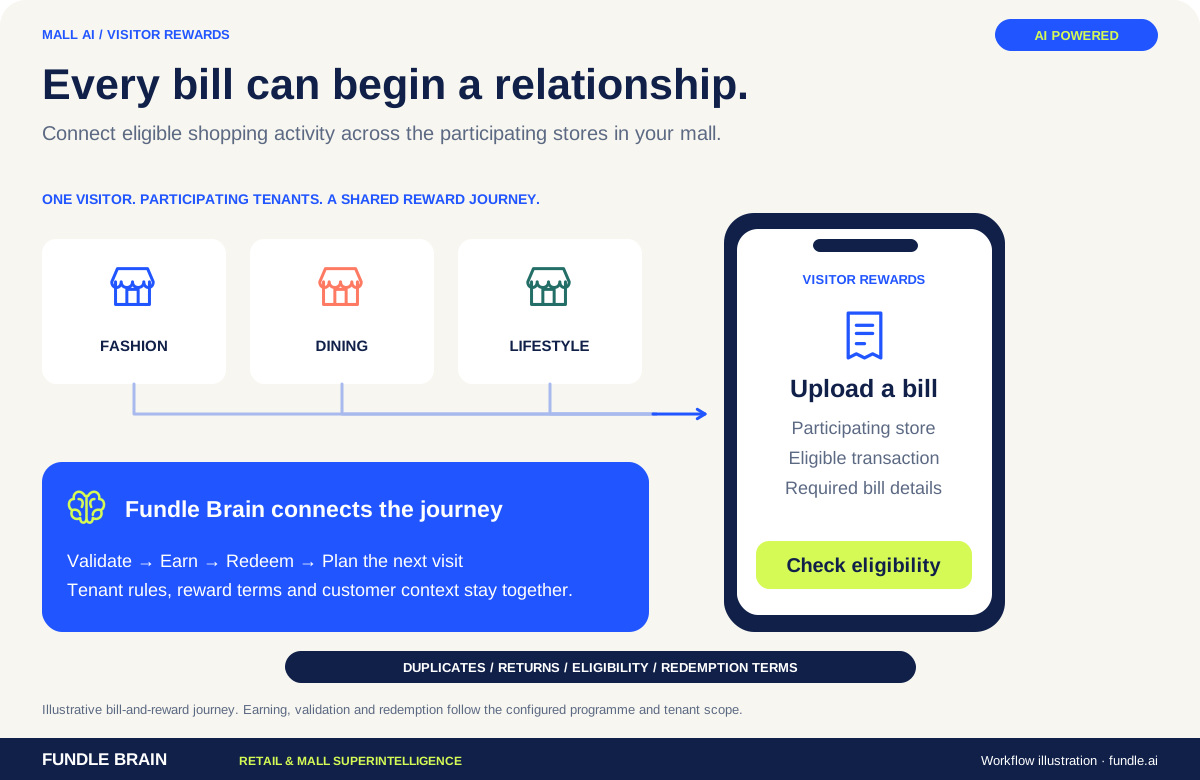
Connect eligible purchases, visitor rewards and tenant participation into a mall-wide programme with clear earning and redemption rules.
Explore the platform ↗Bring us one business problem. We’ll map the data, the workflow and the next useful action.
Hi 👋 I'm Abhinav
Got a loyalty or ADSR question?