Make the economics visible.
Explore an illustrative campaign scenario. These are planning assumptions, not a forecast of Fundle results.
What changes
when the campaign works?
Assumes the difference in purchase rates is caused by the campaign.
How to measure incrementality ↗The calculation
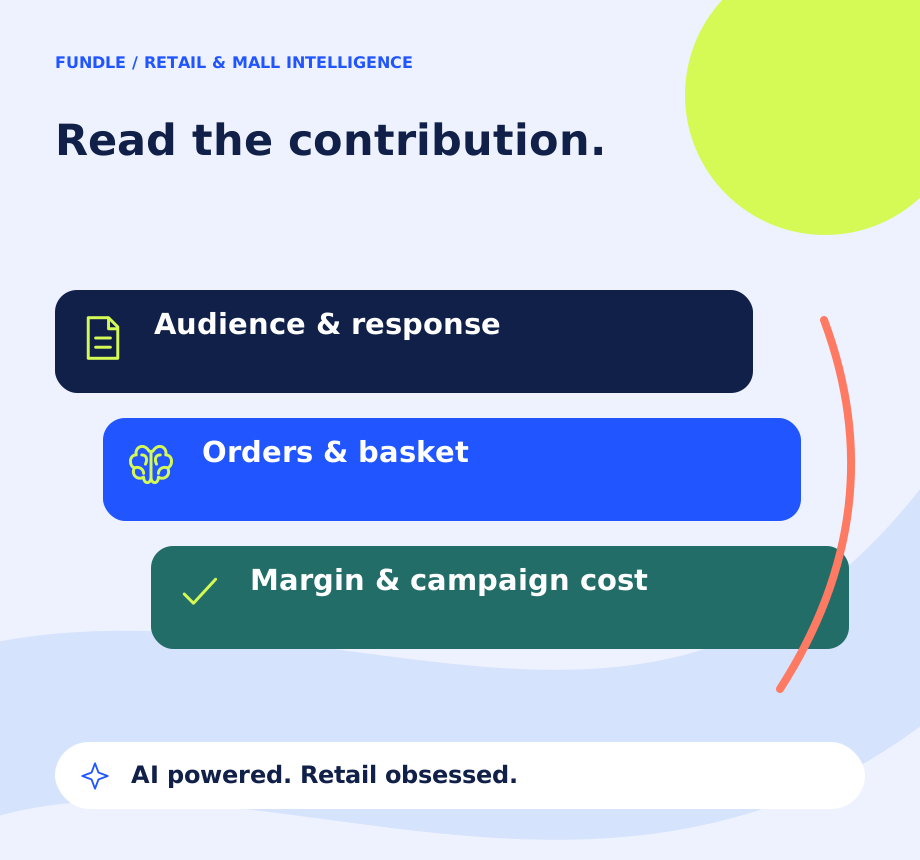
Incremental orders = audience × (campaign purchase rate − baseline purchase rate). Incremental revenue = incremental orders × average order value. Net incremental contribution = incremental revenue × contribution margin − campaign cost. ROI = net incremental contribution ÷ campaign cost.
This simplified model does not establish causation, statistical significance, long-term customer value or the impact of multiple purchases. Use a credible experiment and return-adjusted data to assess actual results.
What would you ask Fundle Brain?
Bring us one business problem. We’ll map the data, the workflow and the next useful action.
Campaign intelligence
in motion.
24 seconds · Silent film with on-screen captions · Workflow illustration.
Read the film transcript
- The business question
Bring back high-value customers who have stopped buying.
- The workflow moments
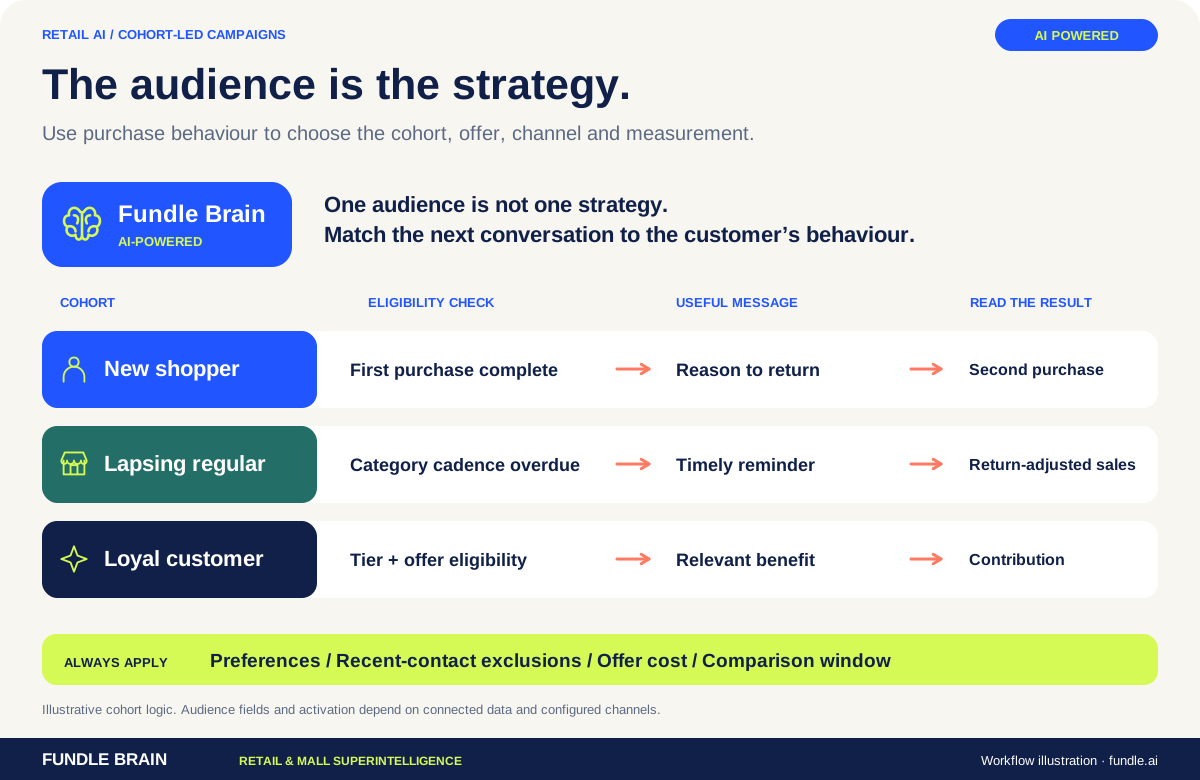
New shopper → Lapsing regular → Loyal customer → Different journeys. Lapsed customers + category affinity + permission
- The operating map
The right cohort. The right next conversation. Explore the infographic below the film for the full workflow.
- The next useful action
Prepare creative and an approval-ready campaign. Incremental orders · gross margin · opt-outs
The right cohort. The right next conversation.
Move from a broad discount blast to a precise audience, a relevant offer and a clear way to measure the result.