Measure whether loyalty changes customer behaviour
How can retailers measure the incremental value of a loyalty programme?
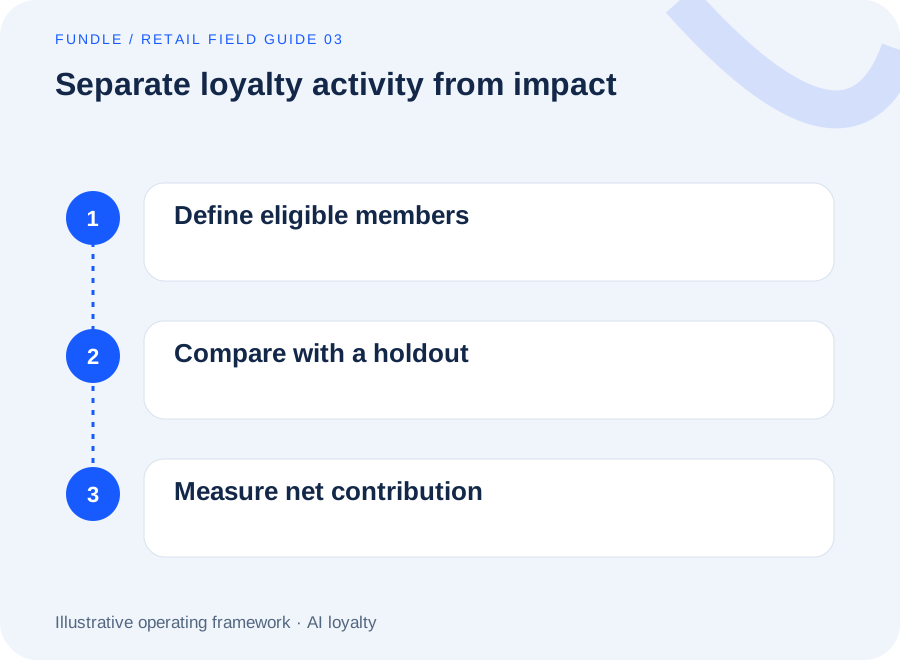
Estimate loyalty incrementality by comparing outcomes for otherwise comparable customers who are assigned different eligible programme experiences. Preserve promised benefits, define the intervention precisely and measure all assigned customers over equal periods. Evaluate repeat purchase and contribution after programme costs. Member spending, redemptions and attributed revenue describe activity, but they do not by themselves show what the programme caused.
Decide which loyalty effect you want to measure
A programme contains several interventions: membership, recognition, points, reminders, rewards and service experiences. Asking whether loyalty works is too broad unless you specify which of these changes. A test of an extra reward reminder estimates that reminder's effect among eligible members. It does not estimate the value of the entire membership programme since launch.
Write the decision in commercial terms. You might ask whether a proposed member benefit creates enough additional contribution to justify its operating cost. Specify the eligible population, the existing experience and the proposed change. Keep benefits already promised to customers intact; measure an additional intervention or a legitimately staged introduction whose terms are clear.
Avoid the member-versus-non-member trap
Members often differ from non-members before joining. They may already shop frequently, prefer the brand or be more willing to share information. Comparing their average spending can describe the membership base, but it cannot isolate the programme's effect. The difference may reflect who enrolled rather than what changed after enrolment.
Before-and-after comparisons have another problem. Festivals, assortment changes, store openings, stock availability and competing promotions can all influence sales. A rise after launch is useful business context, not automatic causal proof. Retain historical trends, but use them to interpret a credible comparison instead of treating them as a substitute for one.
When random assignment is not feasible, an analyst may build a matched comparison using observed pre-treatment behaviour. Label that result as observational and explain the remaining possibility of unmeasured differences. More sophisticated modelling cannot guarantee that every reason for enrolment has been captured.
Choose outcomes with stable denominators
Use the original assigned customer count as the denominator for the main experimental comparison. Customers who never open a message or redeem a reward still belong in their assigned group. Removing them after assignment creates a selected population and can make an ineffective intervention appear attractive.
| Measure | Numerator | Denominator or basis |
|---|---|---|
| Repeat-buyer rate | Customers with a qualifying repeat purchase | All assigned customers |
| Orders per customer | Qualifying orders after assignment | All assigned customers |
| Contribution per customer | Net contribution over the window | All assigned customers |
| Redemption rate | Customers redeeming the relevant benefit | Clearly specified eligible or issued population |
| Opt-out rate | New applicable opt-outs | Customers assigned to that contact experience |
Agree whether contribution already includes reward redemption cost, returns, delivery and variable service costs. Keep that cost dictionary unchanged between groups. Redemptions can explain how a programme operates, while contribution answers whether the changed experience created economic value.
Build a comparison that survives operations
Randomise at a level that limits spillover. Customer-level assignment may be appropriate for private communications. A store-wide benefit visible to everyone may require a store or catchment design, with analysis that respects that grouped assignment. Customers crossing stores and sharing household accounts can weaken the intended separation.
Google's Conversion Lift documentation describes controlled groups for estimating incremental advertising outcomes. The loyalty design here uses that experimental principle, while requiring its own customer, reward and cost records. Advertising attribution settings do not automatically answer the loyalty question.
Keep an assignment register that records eligibility, group and allocation time. Check that both groups have comparable observation coverage. Microsoft Research's work on sample ratio mismatch shows why unexpected differences in group counts can signal experiment defects. Investigate missing or selectively filtered customers before interpreting lift.
Worked hypothetical example: a member-benefit pilot
Assume 3,000 eligible members are randomly assigned to a benefit pilot: 2,000 receive an additional experience and 1,000 retain the existing programme. Both groups keep all existing entitlements. Over an equal follow-up window, 260 pilot members and 100 comparison members make a qualifying repeat purchase.
The pilot rate is 260 divided by 2,000, or 13%. The comparison rate is 100 divided by 1,000, or 10%. The difference is three percentage points. Multiplying that difference by the 2,000 pilot members gives an estimated 60 additional repeat buyers. The unequal group sizes make raw counts a misleading comparison.
Now assume contribution after returns and variable programme costs totals ₹1,26,000 in the pilot group and ₹56,000 in the comparison group. Contribution per assigned member is ₹63 and ₹56 respectively. The difference of ₹7 implies ₹14,000 of incremental contribution across the 2,000 pilot members. If a separate ₹4,000 setup cost has not already been included, the pilot's illustrative net gain after that cost is ₹10,000.
This is a point estimate, not evidence from a Fundle customer. Its uncertainty depends on sample size, outcome variability and assignment quality. Do not subtract the same reward cost again if it was already included in the contribution totals.
Distinguish pull-forward from lasting improvement
A short promotion may shift next month's purchase into this month. Follow customers beyond the immediate redemption period to see whether the apparent gain persists. Report the early response and the later cumulative result separately, using the same cohort. Avoid comparing a fully matured control period with an incomplete treatment period.
Inspect category substitution and channel movement. A customer may redeem in a store instead of buying online, creating a store-level increase without an enterprise-level gain. Where identity coverage allows, measure the agreed channels together. Where it does not, state which sales are missing and keep claims within that boundary.
Commercial review checklist
- Name the exact benefit or experience being tested.
- Document the comparison experience and preserve existing customer promises.
- Freeze assignment, outcome definitions and cost treatment before launch.
- Reconcile group counts, transaction coverage and late returns.
- Report absolute differences, uncertainty and contribution together.
- Review longer-term demand and channel substitution before expansion.
Bring this scorecard to a Loyalty and CLM discussion, supported by retail intelligence. Request a Fundle workflow walkthrough showing how your team would review the underlying cohort and cost evidence. Confirm which measurement and approval steps are available in the proposed configuration.
Questions from retail teams
Does higher spending by members prove programme success?
No. Members may have been stronger customers before joining, so the difference can reflect selection. Use member spending to understand the programme population, then evaluate a defined change with a credible comparison. If only observational analysis is possible, disclose its assumptions and avoid presenting the full spending difference as revenue caused by loyalty.
Can we measure incrementality without removing existing benefits?
Yes. Test an additional benefit, a new communication or a staged enhancement while preserving the base programme and its promises. Define exactly what differs between groups. The result then measures that added experience for the eligible population, rather than claiming to estimate the value of every historical component of the programme.
Why should non-redeemers remain in the analysis?
Whether a customer redeems is an outcome of the experience, not a neutral eligibility rule. Removing non-redeemers selects a more responsive group after assignment. Keep everyone assigned in the main comparison and use redemption as a diagnostic measure. This answers what happens when the business offers the intervention to an eligible customer.
Should we report incremental revenue or incremental contribution?
Both can be informative, but they answer different questions. Revenue shows additional sales value on the agreed basis. Contribution also considers product economics, returns and relevant variable programme costs. State what is included in the calculation and keep the treatment consistent. A campaign can produce positive revenue lift while reducing contribution after rewards.
What if the programme changes halfway through the test?
Record the change and assess whether it affects both groups or only one. A material change can alter the intervention being evaluated and make the original result difficult to interpret. Do not silently combine different programme versions. The team may need to close the original analysis window and start a newly specified test.
Sources and further reading
- Google Ads: About Conversion Lift — Controlled treatment/comparison approach to advertising causal effects; loyalty scorecard, examples and commercial guidance are original.
- Microsoft Research: Diagnosing Sample Ratio Mismatch in A/B Testing — Unexpected experimental group ratios may reveal assignment, logging or analysis defects. No frequency statistics reproduced.